
DORA Metrics
Knowing your pipeline runs is not the same as knowing it works well. Measuring CI/CD is about evaluating the quality of the delivery process itself - not just whether the servers are up.
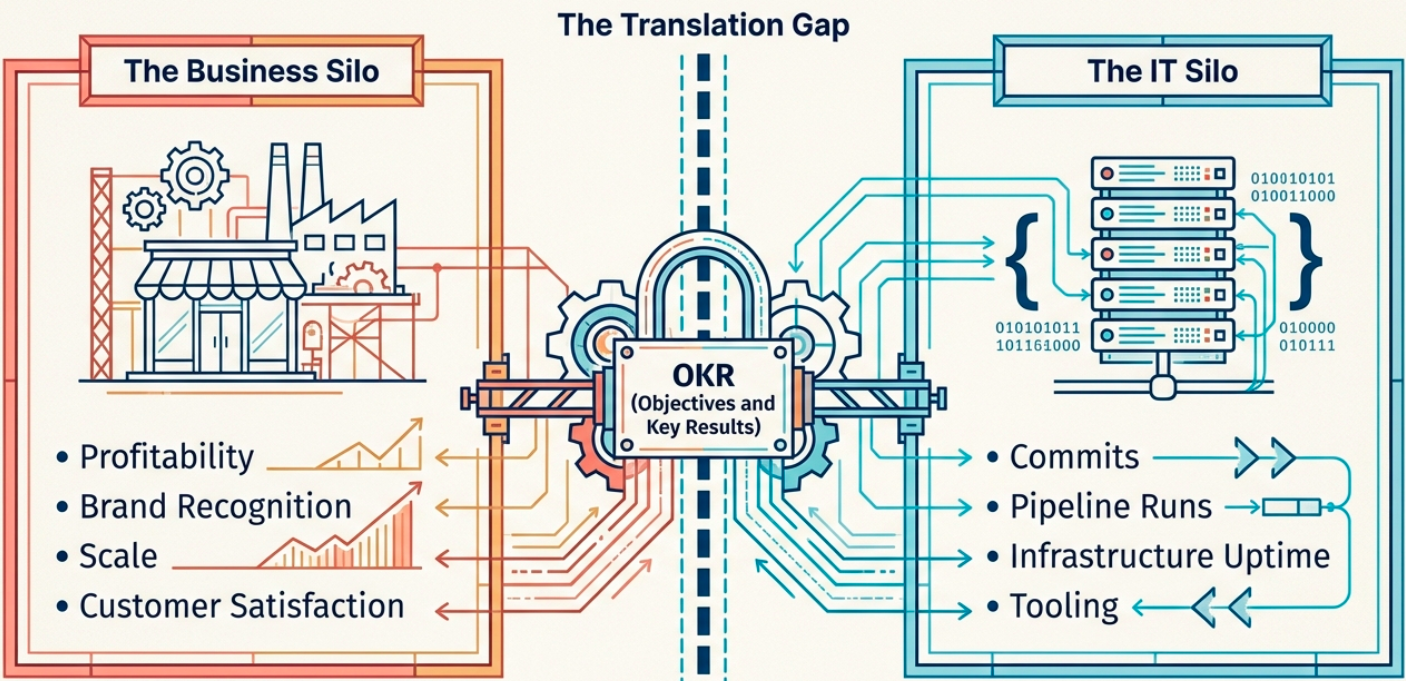
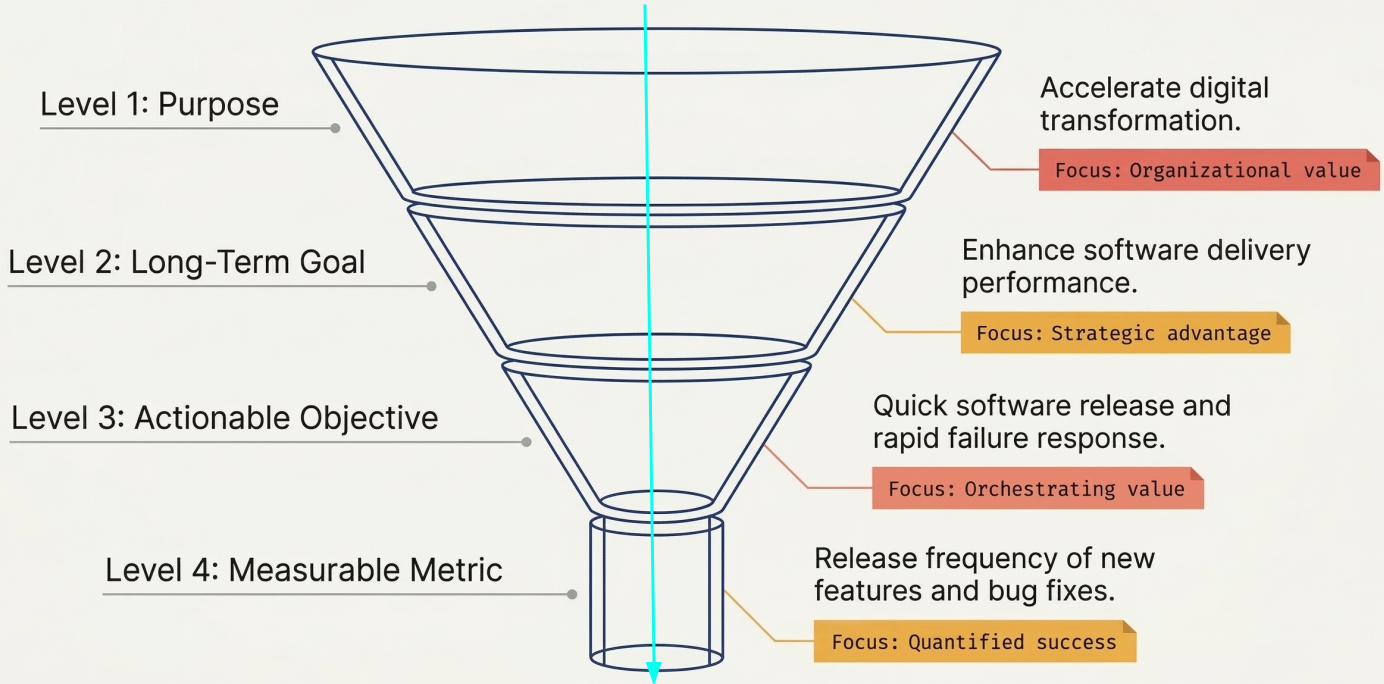
The challenge is choosing measurements that are both relevant to the business and achievable by the technical team. This requires IT and business units to collaborate, which is where frameworks like OKRs (Objectives and Key Results) help: they map the technical outcomes of a CI/CD system to the strategic goals the organization actually cares about.
| CI/CD Feature | What it drives | Business outcome |
|---|---|---|
| Reusability | Cost-efficient components shared across pipelines | Improved profitability |
| Abstraction | New features added without major rework | Competitive advantage |
| Maintainability | Systems that are easier to support and evolve | Higher reliability + customer satisfaction |
| Flexibility | Fast response to market or requirement changes | Brand recognition through innovation |
The DORA Framework
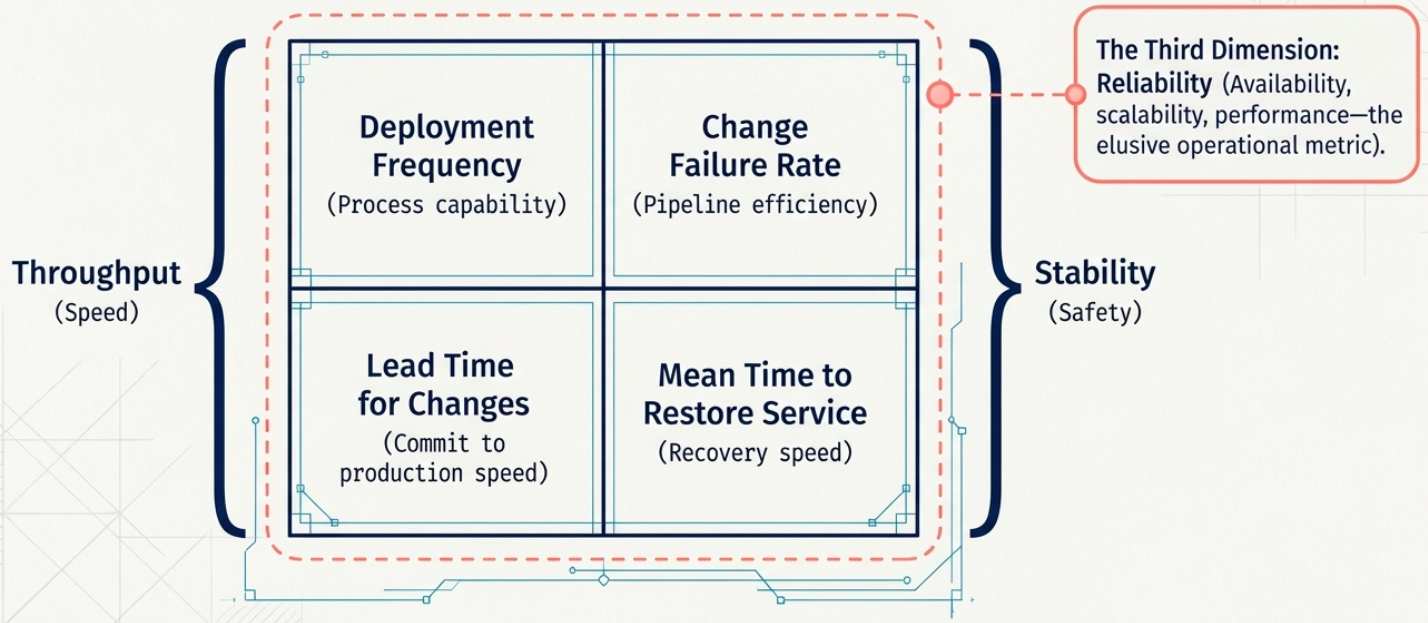
Section titled “The DORA Framework”DORA (DevOps Research and Assessment), originating at Google, is the most widely adopted model for measuring software delivery performance. It evaluates effectiveness across two axes:
- Throughput - how capable the process is at delivering change
- Stability - how robust the process is when things go wrong
Throughput Metrics
Section titled “Throughput Metrics”| Metric | What it measures | Why it matters |
|---|---|---|
| Deployment Frequency | How often code is successfully deployed to production | Higher frequency = smaller changes = lower risk per deployment |
| Lead Time for Changes | Time from first code commit to that change running in production | Shorter lead time = faster value delivery and faster feedback |
Stability Metrics
Section titled “Stability Metrics”| Metric | What it measures | Why it matters |
|---|---|---|
| Change Failure Rate | The ratio of deployments that result in failures requiring a fix or rollback | High CFR signals quality or process problems that compound over time |
| Mean Time to Restore (MTTR) | Time to recover and re-deploy after a pipeline or production failure | Low MTTR means the team can detect and respond quickly when things break |
The Third Dimension: Reliability
Section titled “The Third Dimension: Reliability”In the early 2020s, DORA added reliability as a third complementary dimension. Unlike the four core metrics, reliability is not a single quantifiable number - it draws on system-level factors like availability, scalability, and sustained performance under load.
Complementary Measurements
Section titled “Complementary Measurements”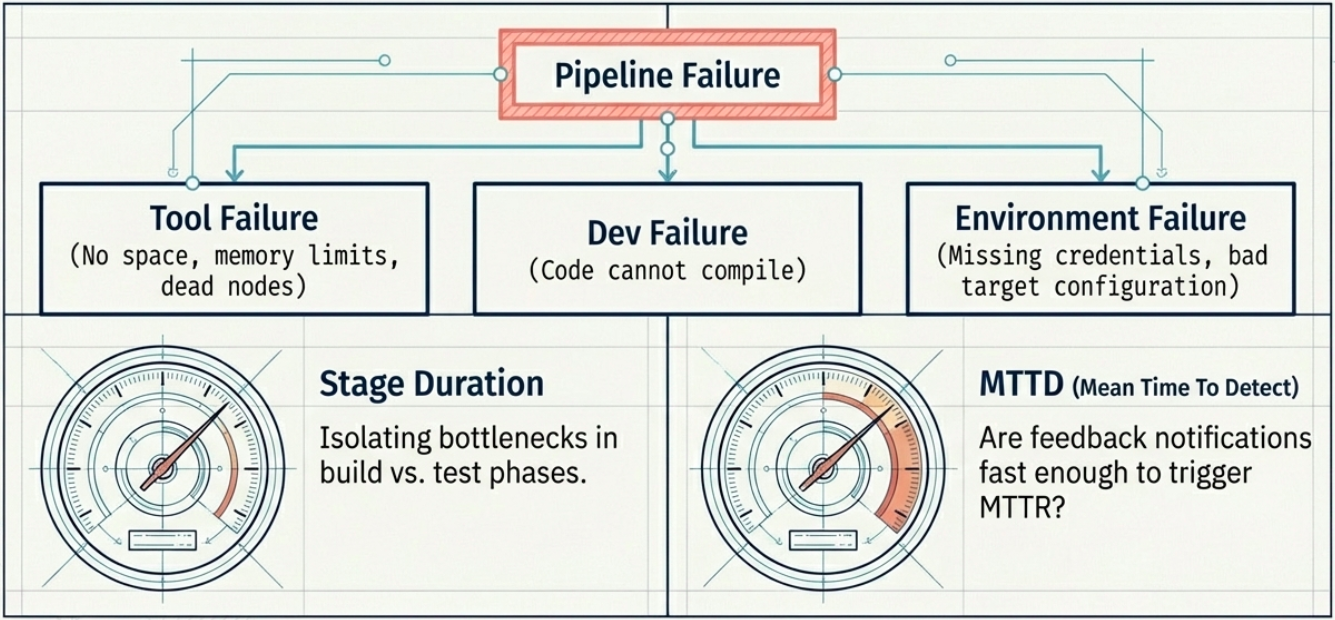
The four core DORA metrics give you a high-level picture, but they can lead to incomplete conclusions in isolation. These supporting measurements help triangulate the root cause when something looks wrong:
| Metric | What it measures | When to use it |
|---|---|---|
| Build success rate | Ratio of successful pipeline runs. Failures categorize into CI/CD tool errors, development errors (compilation), or environment errors (misconfiguration). | Diagnosing where pipeline failures are concentrated |
| Stage duration | Time spent in individual stages - build, test, deploy | Identifying which step is the bottleneck slowing lead time |
| Test coverage | Percentage of codebase exercised by automated tests | Essential diagnostic when change failure rate is high |
| Mean Time to Detect (MTTD) | Time between an issue occurring and the team becoming aware of it | Reveals gaps in feedback loops and automated alerting |
Feedback Loops
Section titled “Feedback Loops”Feedback loops are the mechanism that makes DORA metrics actionable. A well-designed pipeline doesn’t just run - it reports back at every stage with enough signal to act on.
Key design principles for effective feedback loops:
- Define fine-grained feedback triggers across multiple pipeline stages, not just at the end
- Alert on stage duration regressions - a test stage that used to run in 3 minutes taking 12 minutes is a signal, not noise
- Distinguish failure types (tool crash vs. bad code vs. broken environment) to route the right fix to the right owner
AI-Powered Observability
Section titled “AI-Powered Observability”Traditional pipeline monitoring captures what happened. AI-powered observability tools go further - they analyze patterns across metrics, logs, and traces to surface why it happened and predict what’s about to break.
Tools like Datadog, Prometheus + Grafana, and New Relic represent the modern observability stack for CI/CD pipelines. Unlike passive logging, they interpret the data in real time.
Core Observability Functions
Section titled “Core Observability Functions”| Function | What it does |
|---|---|
| Metrics collection | Gathers real-time system performance data - CPU, memory, queue depth, pipeline stage duration - continuously across the delivery system |
| Log analysis | Tracks errors, application events, and system interactions across distributed services with structured querying and filtering |
| Distributed tracing | Captures requests as they flow through distributed systems, showing exactly how individual services interact and where latency accumulates |
| Observability reporting | Correlates metrics, logs, and traces into unified dashboards for deep insight into application behavior and pipeline health |
Findings are automatically routed to notification tools (Slack, PagerDuty, Opsgenie), closing the loop between a detected signal and the team that needs to act on it.
AI-Enhanced Capabilities
Section titled “AI-Enhanced Capabilities”Where rule-based alerting fires when a threshold is crossed, machine learning identifies patterns across thousands of data points to catch issues that static rules never would:
| Capability | What it means in practice |
|---|---|
| Proactive bottleneck detection | Identifies performance degradation trends before they impact users - e.g., a test stage progressively slowing that will breach SLA thresholds within 48 hours |
| Anomaly and threat detection | Continuously scans CI/CD data volumes to surface unusual code changes, irregular access patterns, or dependency anomalies that indicate a potential security vulnerability |
| Automated threat response | When a security anomaly meets a confidence threshold, the system automatically isolates the affected area and triggers containment protocols - reducing the response window and eliminating manual incident bottlenecks |
| Compliance monitoring | Continuously verifies that required security controls are active across the pipeline and auto-generates audit reports, eliminating the manual evidence-collection burden in regulated environments |