
tcpdump - Packet Capture
What is tcpdump?
Section titled “What is tcpdump?”tcpdump is a command-line packet analyzer. It captures raw network traffic passing through an interface and lets you inspect it in real-time or save it to a file for later analysis.
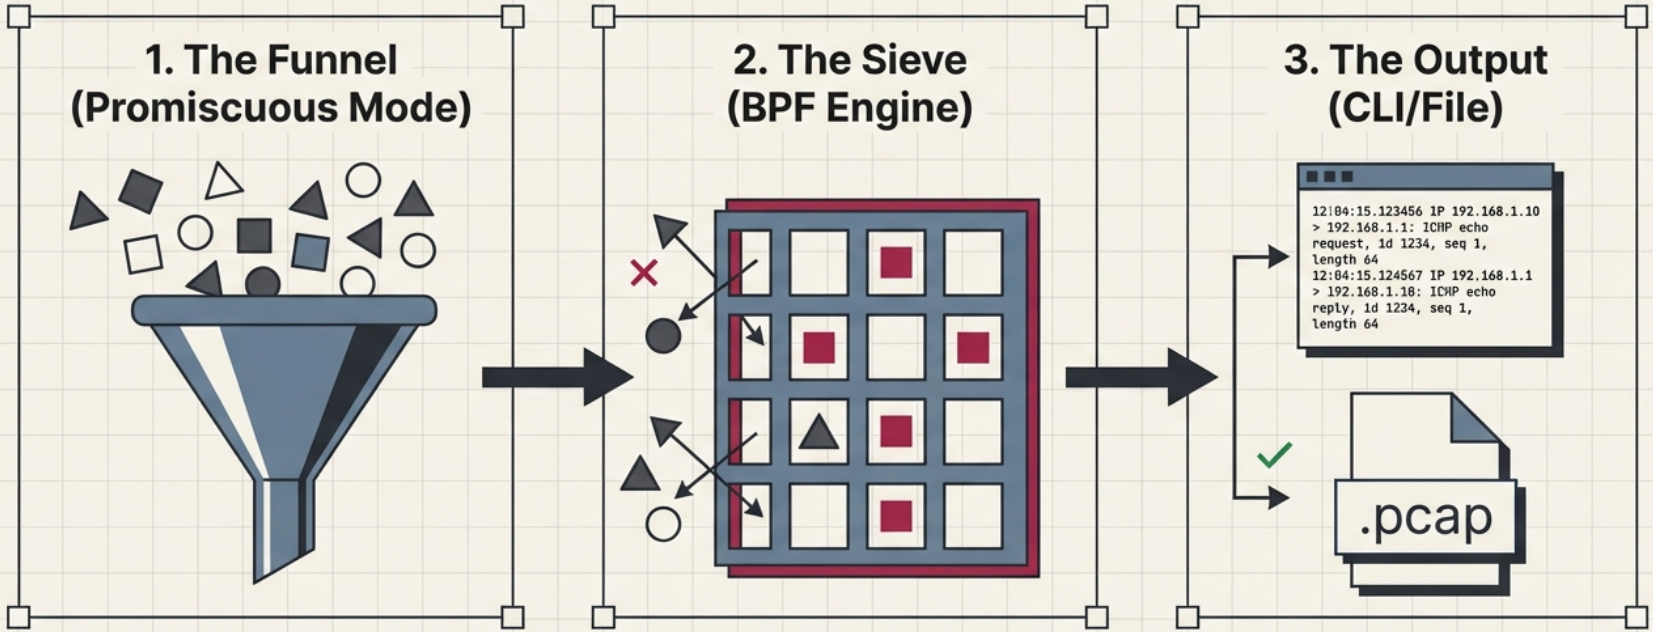
It works by putting the network interface into promiscuous mode (captures all frames, not just those addressed to the host) and applying BPF (Berkeley Packet Filter) expressions to select what to capture.
Basic Usage
Section titled “Basic Usage”# List available interfacestcpdump -D# 1.eth0 [Up, Running, Connected]# 2.lo [Up, Running, Loopback]
# Capture on a specific interface (Ctrl+C to stop)sudo tcpdump -i eth0
# Capture with verbose outputsudo tcpdump -v -i eth0
# Even more verbose (shows all header fields)sudo tcpdump -vv -i eth0
# Don't resolve hostnames or port names (faster, shows raw IPs:ports)sudo tcpdump -n -i eth0
# Combine bothsudo tcpdump -nn -i eth0Reading tcpdump Output
Section titled “Reading tcpdump Output”12:34:56.789012 IP 192.168.1.50.42156 > 8.8.8.8.53: UDP, length 29│ │ │ │ │ │ │ └─ payload size│ │ │ │ │ │ └─ protocol│ │ │ │ │ └─ destination port│ │ │ │ └─ destination IP│ │ │ └─ source port (ephemeral)│ │ └─ source IP│ └─ protocol (IP/IP6/ARP/etc)└─ timestamp (HH:MM:SS.microseconds)Capturing to Files
Section titled “Capturing to Files”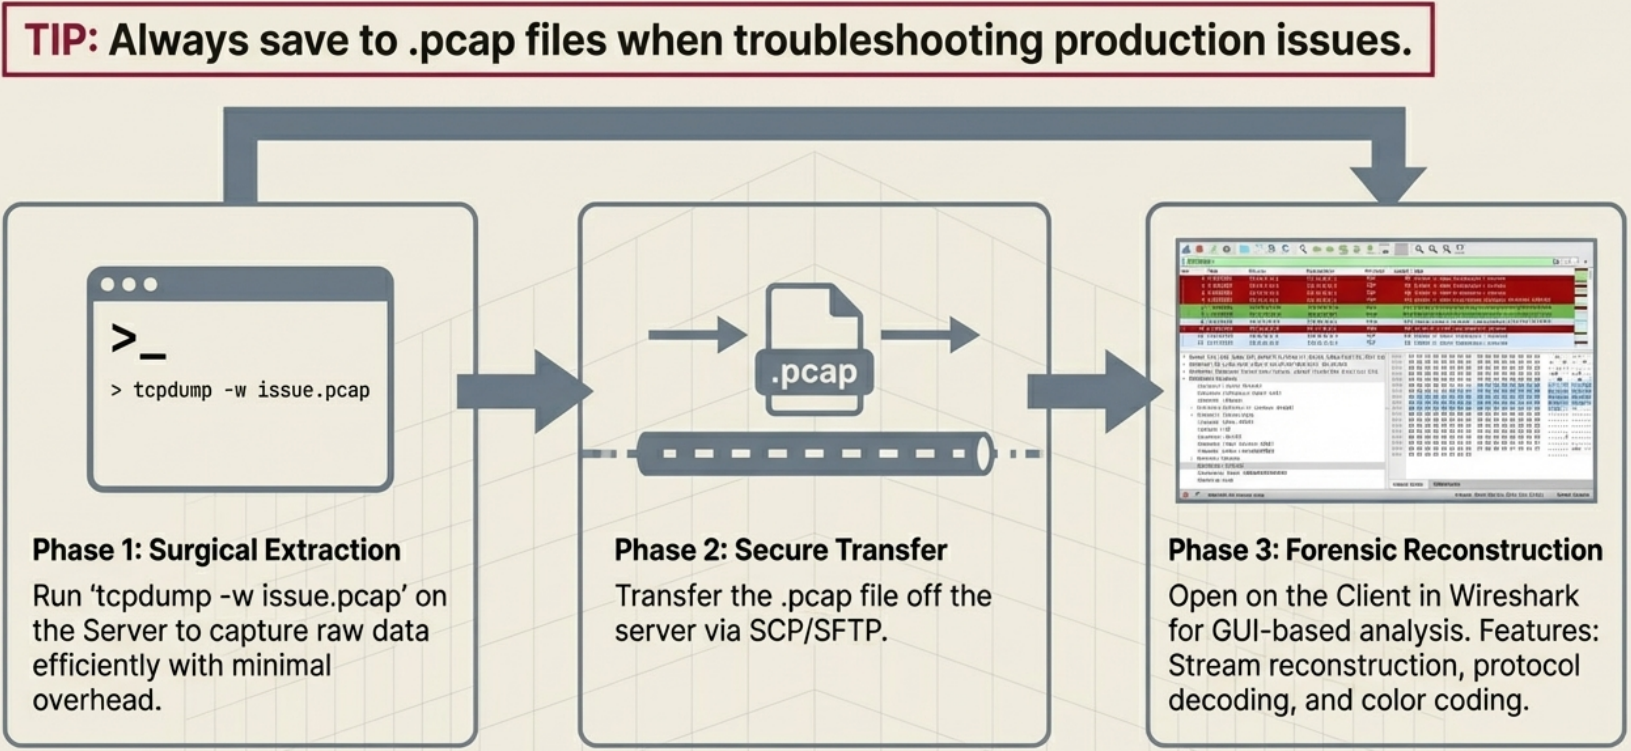
# Save to a .pcap file (can be opened in Wireshark)sudo tcpdump -i eth0 -w capture.pcap
# Save with rotation (1MB files, keep last 5)sudo tcpdump -i eth0 -w capture.pcap -C 1 -W 5
# Read from a saved filetcpdump -r capture.pcap
# Read with no name resolutiontcpdump -nn -r capture.pcap
# Read with verbose outputtcpdump -vv -r capture.pcapBPF Filter Expressions
Section titled “BPF Filter Expressions”
Filters are the most important part of tcpdump - without them you see everything and it’s overwhelming.
Filter by Host or Network
Section titled “Filter by Host or Network”# Traffic to or from a specific hostsudo tcpdump -nn -i eth0 host 8.8.8.8
# Traffic from a specific host (source only)sudo tcpdump -nn -i eth0 src host 192.168.1.50
# Traffic to a specific host (destination only)sudo tcpdump -nn -i eth0 dst host 10.0.0.1
# Entire subnetsudo tcpdump -nn -i eth0 net 192.168.1.0/24Filter by Port or Protocol
Section titled “Filter by Port or Protocol”# All traffic on port 80sudo tcpdump -nn -i eth0 port 80
# All TCP trafficsudo tcpdump -nn -i eth0 tcp
# All UDP trafficsudo tcpdump -nn -i eth0 udp
# All ICMP (ping) trafficsudo tcpdump -nn -i eth0 icmp
# DNS traffic specifically (UDP port 53)sudo tcpdump -nn -i eth0 udp port 53
# HTTP trafficsudo tcpdump -nn -i eth0 tcp port 80
# HTTPS traffic (encrypted - you'll see TLS handshakes but not content)sudo tcpdump -nn -i eth0 tcp port 443Combining Filters
Section titled “Combining Filters”# AND - both conditions must be truesudo tcpdump -nn -i eth0 host 8.8.8.8 and port 53
# OR - either conditionsudo tcpdump -nn -i eth0 port 80 or port 443
# NOT - exclude a patternsudo tcpdump -nn -i eth0 not port 22
# Complex example: HTTP from a specific host, not SSHsudo tcpdump -nn -i eth0 src host 192.168.1.50 and port 80 and not port 22
# Parentheses for groupingsudo tcpdump -nn -i eth0 host 192.168.1.50 and '(port 80 or port 443)'Practical Recipes
Section titled “Practical Recipes”Debug DNS Failures
Section titled “Debug DNS Failures”# Watch all DNS queries and responsessudo tcpdump -nn -i eth0 udp port 53 -v
# Output example showing a query and response:# 12:34:56 IP 192.168.1.50.5432 > 8.8.8.8.53: A? google.com. (28)# 12:34:56 IP 8.8.8.8.53 > 192.168.1.50.5432: A google.com. 142.250.185.46 (44)Debug HTTP Connections
Section titled “Debug HTTP Connections”# Capture HTTP and show content (ASCII)sudo tcpdump -nn -i eth0 tcp port 80 -A
# Show first 200 bytes of each packet (headers often visible)sudo tcpdump -nn -i eth0 tcp port 80 -A -s 200
# -A = print packet data as ASCII# -s = snap length (bytes to capture per packet, default 262144)Debug TCP Connection Issues
Section titled “Debug TCP Connection Issues”# Show only TCP SYN packets (new connection attempts)sudo tcpdump -nn -i eth0 'tcp[tcpflags] & tcp-syn != 0'
# Show only TCP RST packets (rejected connections)sudo tcpdump -nn -i eth0 'tcp[tcpflags] & tcp-rst != 0'
# Show SYN and RST together (problems connecting to a port)sudo tcpdump -nn -i eth0 'tcp[tcpflags] & (tcp-syn|tcp-rst) != 0'
# See TCP connections between two hostssudo tcpdump -nn -i eth0 host 10.0.0.1 and host 10.0.0.2 and tcpCheck if Traffic is Reaching an Interface
Section titled “Check if Traffic is Reaching an Interface”# Useful when you suspect a routing problem# Check if packets from a source are arriving at allsudo tcpdump -nn -i eth0 src host 192.168.1.100
# If you see nothing, packets are being dropped before reaching this interface# Check firewall rules, routing table, and switch portCapture ARP Traffic
Section titled “Capture ARP Traffic”# Debug ARP resolution issues (duplicate IPs, ARP spoofing)sudo tcpdump -nn -i eth0 arp
# Output:# 12:34:56 ARP, Request who-has 192.168.1.1 tell 192.168.1.50, length 28# 12:34:56 ARP, Reply 192.168.1.1 is-at aa:bb:cc:dd:ee:ff, length 28tcpdump on a Specific Process
Section titled “tcpdump on a Specific Process”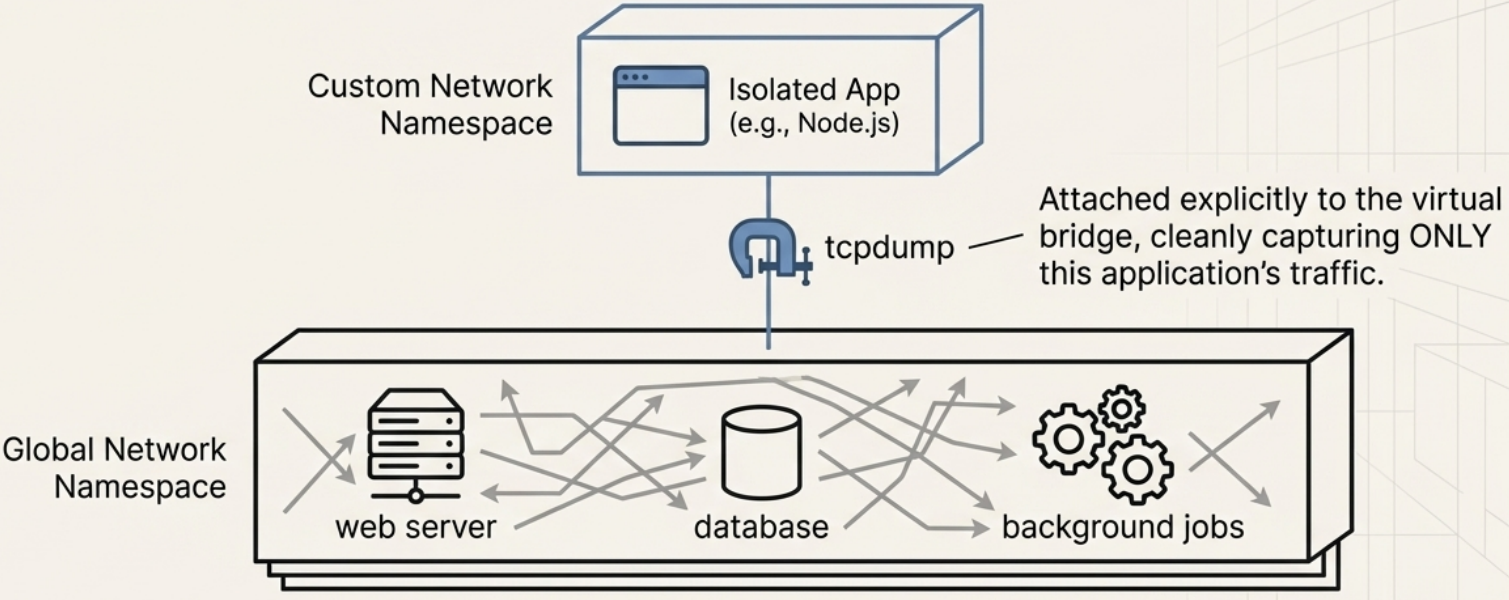
Linux doesn’t have per-process packet capture natively, but you can:
# Find the PID and its connectionsss -tlnp | grep <port>
# Then drop unrelated traffic with filterssudo tcpdump -nn -i eth0 port <port the process is using>
# For containerized apps, capture on the container's veth interface# (found with: ip link show | grep veth, then ip link show <vethXXX>)
Quick Reference
Section titled “Quick Reference”| Flag | Meaning |
|---|---|
-i eth0 | Interface to capture on |
-n | Don’t resolve hostnames |
-nn | Don’t resolve hostnames or port names |
-v / -vv | Verbose / very verbose output |
-A | Print packet payload as ASCII |
-w file.pcap | Write to file |
-r file.pcap | Read from file |
-c 100 | Capture only 100 packets |
-s 0 | Capture full packets (no truncation) |
-e | Show Ethernet MAC addresses |
-X | Show hex + ASCII of packet payload |